Deepwater Horizon in Quantitative Context
More on:
I’ve been spending some time this morning trying to understand past estimates of the environmental impacts of oil spills. In the process, I’ve been looking at damage estimates and frequency data for past events. I thought I’d share some of the details (and some great links so that people can learn more). The bottom line is that the most widely accepted projections of potential damages from oil spills that were out there as of a few weeks ago seem to be wrong.
First the damage estimates. The National Academies of Sciences recently released a study titled Hidden Costs of Energy: Unpriced Consequences of Energy Production and Use. They note that “little research is available to estimate the expected damages from spills that could be appropriately attributed on a per gallon transported basis”. (Modern estimates tend to focus on spills from oil transport since that, rather than spills from wells, has recently been the primary focus of attention. Oops.) This is striking in itself – it is essentially impossible to do serious cost-benefit analyses for regulatory and policy decisions when one doesn’t have a good sense of the potential consequences.
That said, they cite work that looked at eleven spills in depth and found that the marginal damages per gallon spilled were $13.01, which is equivalent to $546.42 per barrel. If one translates that to the current incident, assuming 5,000 barrels per day for 50 days, one finds a total of $136.6 million. This is an order of magnitude lower than the estimates being provided by most financial analysts, who invariably put the likely cleanup bill at something north of a billion dollars, and in some cases substantially more. One could in principle argue that the $13.01 figure is only an average –that Deepwater Horizon might be balanced off by far less consequential spills – but that simply isn’t plausible, as we’ll see in a moment.
What about frequency? We’ve heard a lot in recent years that technology has made oil drilling a lot safer. The statistics for the last twenty years seem to bear that out. Between 1990 and 1996, spills from oil facilities into navigable waters totaled between 0.4 and 1.1 million gallons each year. (Lots more interesting data, from the 2000 Census, at that link.) From 2005 to 2008 (excluding Katrina and Rita – I’ll come back to that soon) that had dropped (PDF) to 90,000-160,000 gallons per year. (More great data at that link.) Deepwater Horizon is estimated to be spewing 210,000 gallons each day. (Note that I’ve been looking at data since 1990 – which is to say since Exxon Valdez. I may take a look at the decade before that later.)
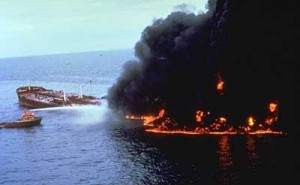
Here are some other numbers worth thinking about. (Data from the two links above unless otherwise noted.) There have been only two incidents in excess of 1 million gallons in the last 20 years.The tanker Mega Borg, in 1990, spilled between 4 and 5 million gallons. (At a rate of 5,000 barrels per day, Deepwater Horizon should take a few weeks to reach that total.) The environmental consequences were limited, since the oil was light Angolan crude, much of which burned off or evaporated. The census reports another spill of 1.8 million gallons in 2005, but I must admit that I’m having trouble matching that up with an actual event. (All the big numbers that year are from from Katrina and Rita, which they claim to exclude.) My best guess is that it’s actually the Citgo refinery accident (PDF) from 2006, though I’d be happy if any readers know better. [UPDATE: A commenter correctly points out that it’s actually the Tankbarge DBL 152.]
Beyond those incidents, during the years 1990-1998, there were 29 incidents in excess of 100,000 gallons, an average of 3.2 per year; during the years 2000, 2005, and 2007-8 (I’m not cherry picking these – they’re the only ones where the Census provides data), that number dropped to 6, an average of 1.2 per year. Remember, again, that these are tiny compared to Deepwater Horizon, which is estimated to be pumping out about 210,000 gallons of oil each day.
The exceptions to the relatively good spill record of the last twenty years come from Hurricane Katrina. NOAA has an amazing database of oil and product spills that anyone who’s curious about all this should check out. I did a search for incidents involving oil (rather than refined products) in excess of a million gallons. The only U.S. incidents since 1990 are from Katrina, with releases of 1.4, 3.8, and 7.8 million gallons. (The links take you to detailed reports on each one.) It’s important to note that, unlike in the Deepwater Horizon case, much of this was contained within berms.
One last bit of context: While the damages from the current spill are clearly high, the economic value of offshore oil production is pretty high too. At 1.5 million barrels per day, and oil priced at $80 per barrel, it’s worth $44 billion each year. (This doesn’t include any negative environmental consequences; it also doesn’t include any benefits from producing domestically rather than abroad.) That is far higher than any of the damage estimates from Deepwater Horizon.
IMAGE CAPTION: Mega Borg: The biggest U.S. oil spill since Exxon Valdez (until now)
More on:
 Online Store

