 Online Store
Introduction
Over the last several decades, governments have collectively pledged to slow global warming. But despite intensified diplomacy, the world is already facing the consequences of climate…

QE and Inflation: The FT Responds to Us, and We to Them
The FT’s Rob Armstrong, in his careful and thoughtful Unhedged post on July 19, responding to our Geo-Graphics post on July 14, raises two objections to our argument that the Fed’s Quantitative Easing (QE) operations from 2020 to 2022 contributed materially to inflation. In his words, his objections are based, first, on “how banks behave” and, second, on “financial plumbing.”
More on:
With regard to how banks behave, Rob says that he has “never heard of talk [from bankers] about the decision to lend or not in terms of having ample liquidity or being liquidity constrained.” Well, the Fed surveys large numbers of bankers regularly, and those bankers most definitely relate their liquidity targets, in the form of reserve levels, to the borrowing behavior of their customers.
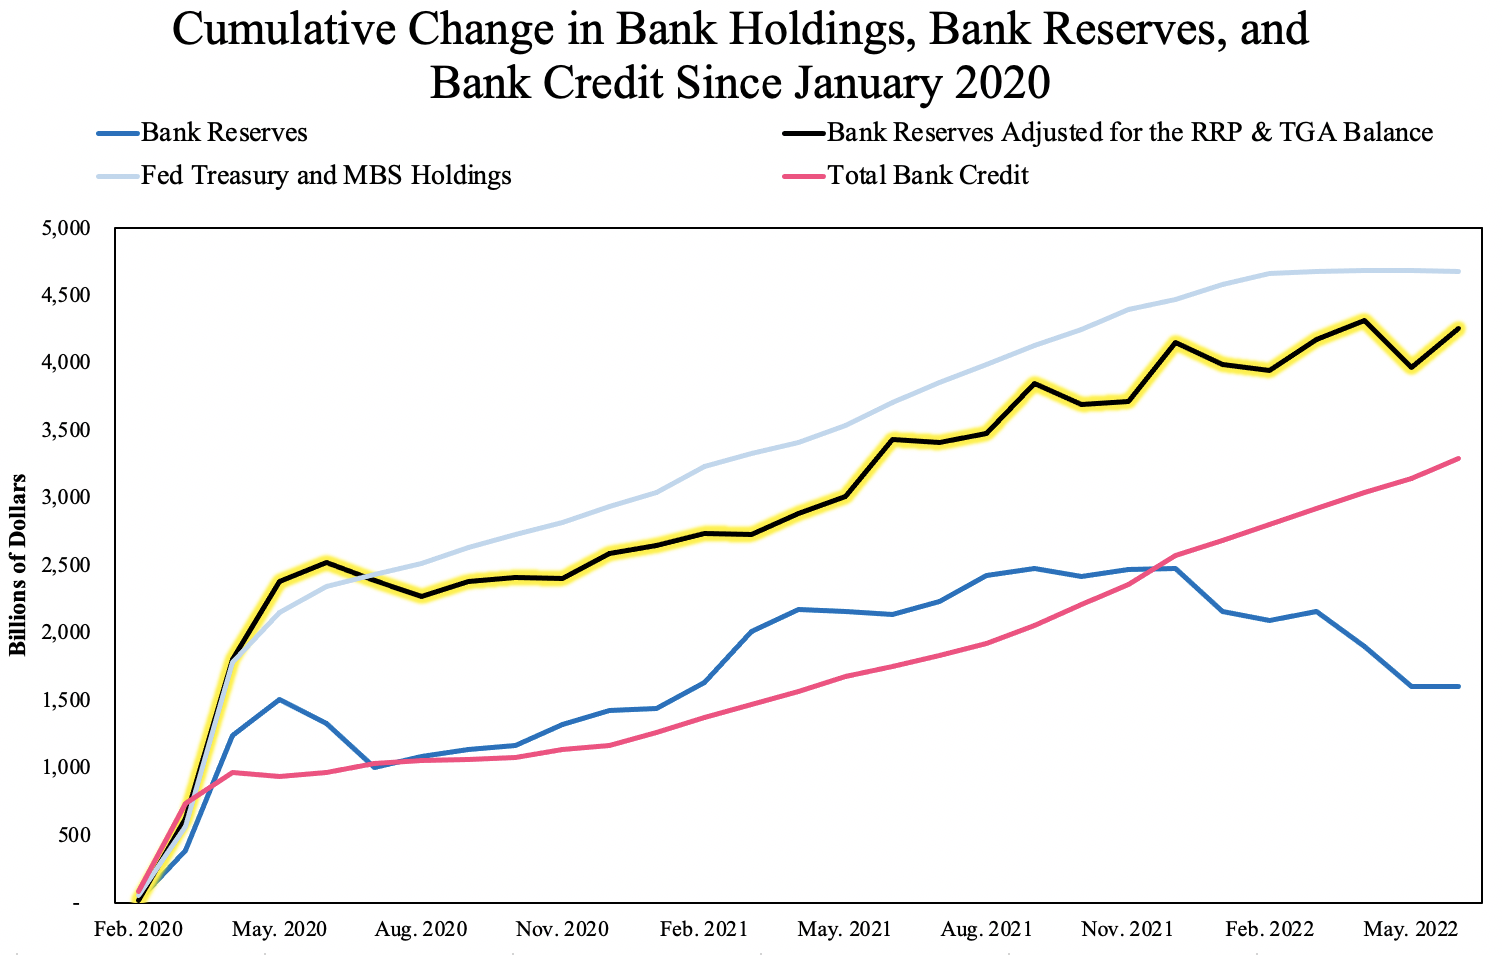
With regard to “financial plumbing,” Rob observes that “lending does not track reserves,” and that we cannot, therefore, logically tie a growing gap between Fed bond holdings and bank reserves to lending and inflation. Rob is right that lending does not always track reserves, as his figure reveals after May 2021. But two important factors drive that divergence.
The first is the Fed’s Overnight Reverse Repurchase Facility (RRP), in which, as Rob notes, banks and money-market funds have parked capital since 2021. The second is the Treasury General Account (TGA)—or the Treasury Department’s own deposit account at the Fed. Just as they do with the RRP, bank reserves fall when the TGA rises (which occurs when the Treasury’s bond and tax revenues exceed its expenditures). Bank reserves adjusted for movements in the RRP and TGA do, in fact, track lending closely, as the figure above shows.
Fluctuations in bank reserves, moreover, carry different implications for inflation depending on the source. In 2020, reserves dipped as the Treasury sold more bonds, padding its TGA balance to prepare for the massive COVID-19 stimulus. That presaged rises in economic activity, lending, and prices. By contrast, in 2021, surging RRP investments slowed reserve growth. Investors flocked to the RRP because the Fed’s interest on reserves sank below reverse repo yields. That anomaly signaled unprecedentedly easy monetary conditions, which were pushing lending up. Abundant liquidity drove down interbank lending costs, sent asset prices soaring, improved borrowers’ creditworthiness, and spurred the chase for yield. By December 2021, bank lending reached its fastest monthly growth rate since 2012 (save for the anomalous first two months of the pandemic).
Trends among bank reserves, the RRP, and the TGA balance have, in short, proved relevant to forecasting inflation. So whereas we thank Rob for prodding us to refine our explanation, the fundamental observation of our blog post holds—“that the gap between central-bank bond holdings and bank reserves is a fairly reliable indicator of where inflation is headed, and that an undesired upturn in the gap is a signal that QE may have outlived its purpose.”
More on:
Creative Commons: Some rights reserved.
This work is licensed under Creative Commons Attribution-NonCommercial-NoDerivatives 4.0 International (CC BY-NC-ND 4.0) License.
View License Detail